Gender Gap
Numerous
media publications portray a worrying divide between boys' and girls'
attainment levels in education (The Telegraph, 2010; Francis, 2010; Richardson,
2011; Paton, 2011; Fogg, 2012). Although a great sense of criticality is needed
when accessing media interpretations of events and topics within societal
issues, media can be a source of information for many individuals. When
encompassing gender inequality and media comprehension of topical issues, it
can be seen that newspapers exaggerate and sensationalise issues (Giddens, 2009;
Haralambos and Holborn, 2008). This can often instigate a sense of moral panic,
a theory introduced by Howard Becker, in the public domain, often deceptively
imposed by the media (Giddens, 2009; Haralambos and
Holborn, 2004). In particular, an article published by The
Telegraph in 2012 stresses the moral panic that can be
created by a media interpretation of an educational issue (Paton). As the
article has been published within a social media domain, readers can pass
judgement and comment on the author and article, which is visible to other users. The
segregation of readers is clear to see and the issue of attainment levels has
been overshadowed by sexism and general disapproval of the author’s contribution.
The importance of contextualising issues is further advanced when accessed
through interpretive means, whether corporate media, social media or social
interaction. The moral panic created could be embellished from statistical fact
(Haralambos and Holborn, 2008; Giddens, 2009). However, GCSE results published
by central government do highlight an inequality of attainment levels, based on
gender (Department for Education, 2013; Department for Education and Skills,
2007; Younger, 2005). In the 1970s, focus was directed at the underachievement
of girls and it is clear that girls have surpassed the gender inequality gap, within education
(Davies et al, 2002; Haralambos and Holborn, 2008). Since the 1990s
girls have consistently outperformed their male peers and the new phenomenon of
'underachieving boys' has been scrutinised by political and societal analysis
(ibid). Gender inequality is a central debate in education and shifts in
educational policy reflect the changing status of gendered inequality (Davies et
al, 2002). Statistical data will be offered in this section to confirm the
notion that girls outperform boys at GCSE level. A comparison of case study
data and national data will be reviewed, although analysis will be further
explored in the Analytical Discussion section.
Word Count: 389
Word Count: 389
The data offered by the case study regarding 2010/11 GCSE attainment levels reflect that of the media recognised 'record-breaking' year for GCSE exams (BBC, 2011a). Although records were broken for the level of attainment, the gender gap was still prominent. Data for the case study suggested that 74% of boys and 76% of girls attained 5 or more A*- C GCSEs, including English and Maths. However, when considering that 84% of boys attained at least 5 A*- C GCSEs, across all subjects in 2011, it shows that boys attain more when results are emphasised with the inclusion of other subjects. The media focus on these core subjects, reduces the attainment percentage offered to the public.
When comparing, in 2011, 84% of boys achieved at least 5 A* - C graded GCSEs compared to 85% of girls, the gender gap at this school is just 1%. The national gender gap for 2011 was placed at 7.3%; the case study’s performance highlights their general achievement of above national standard. Figure 2 provides a comparative graph of gender attainment at the secondary school used for this case study. It is evident that although the gap is smaller than the national average, there is still a divide in attainment levels based on gender.
The national data used in this study has been supplied by the Department of Education (2013). It suggests that nationally the gender gap has, year on year, consistently existed. Figure 1 provides a comparative graph of gender attainment on a national scale. It is reported that the attainment gap, based on gender, has steadily decreased over recent years (Department for Education, 2013). From 2007/08 the gap has reduced by 2.3% across the whole GCSE framework (Ibid). However, when including English and Maths, the gap has widened by 1.4%, this has been aligned with previous narrowing and relative stability before a gap of 2.2% between 2010/11 and 2011/12 (Ibid).
In figure 3 the graph illustrates the comparative data of both the case study and national attainment levels based on gender. The inclusion of the new English Baccalaureate data in the graph highlights that local attainment can conflict with national attainment levels. However, as the English Baccalaureate system is relatively new, there is insufficient data to confirm or discord a general trend in terms of a gender gap.
Finally, figure 4 provides a breakdown of the case study attainment levels by gender and subject. This can be compared with national data using the hyperlink.
Word Count: 411
Figure 1. National: Key Stage 4: Attainment by gender, 2006/07 to 2010/11*
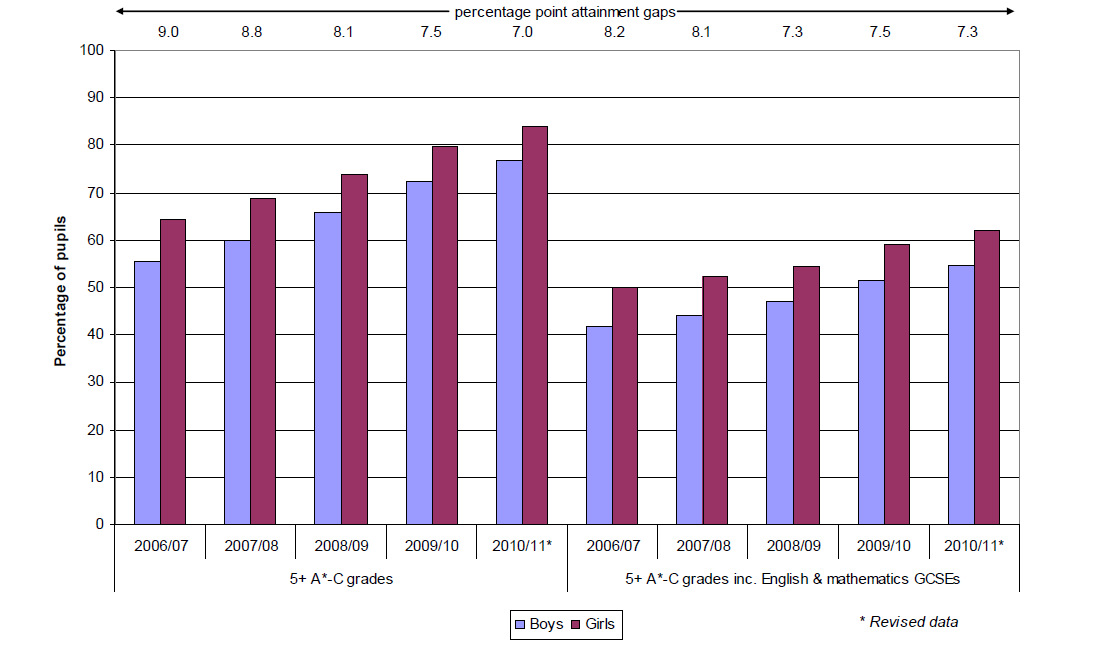
Image provided by the Department for Education, 2012 (https://www.gov.uk/government/uploads/system/uploads/attachment_data/file/167566/sfr03_2012_001.pdf.pdf)
Figure 2. Case Study: Key Stage 4: Attainment by Gender: 2006/07 - 2010/11
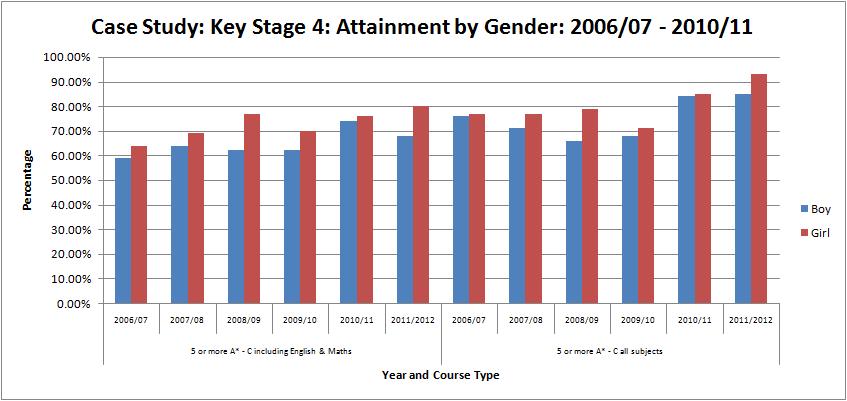
Data provided by [School Name for Case Study]*, 2012
All figures in this graph for the gendered attainment levels of the case study reports have been calculated using unrounded figures; however they are quoted to 1 decimal place (Department for Education, 2012).
All figures in this graph for the gendered attainment levels of the case study reports have been calculated using unrounded figures; however they are quoted to 1 decimal place (Department for Education, 2012).
Figure 3. Case Study and National Comparison: Key Stage 4: Attainment by Gender: 2011
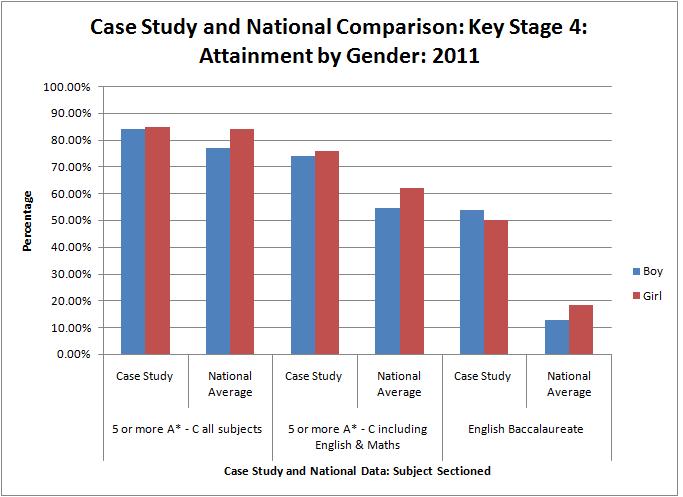
Data provided by the Department for Education, 2012; [School Name for Case Study]*, 2012
* School name removed in accordance with the Data Protection Act 1998
|
Figure 4: This link provides details of the schools 2010/11 GCSE attainment levels, seperated into subjects. The hyperlink provides the same data, but on a national scale.
|
|
||
